Blab Crypto
Wall Street ETF Inflows Signal Bullish Shift as Bitcoin Approaches Key Resistance
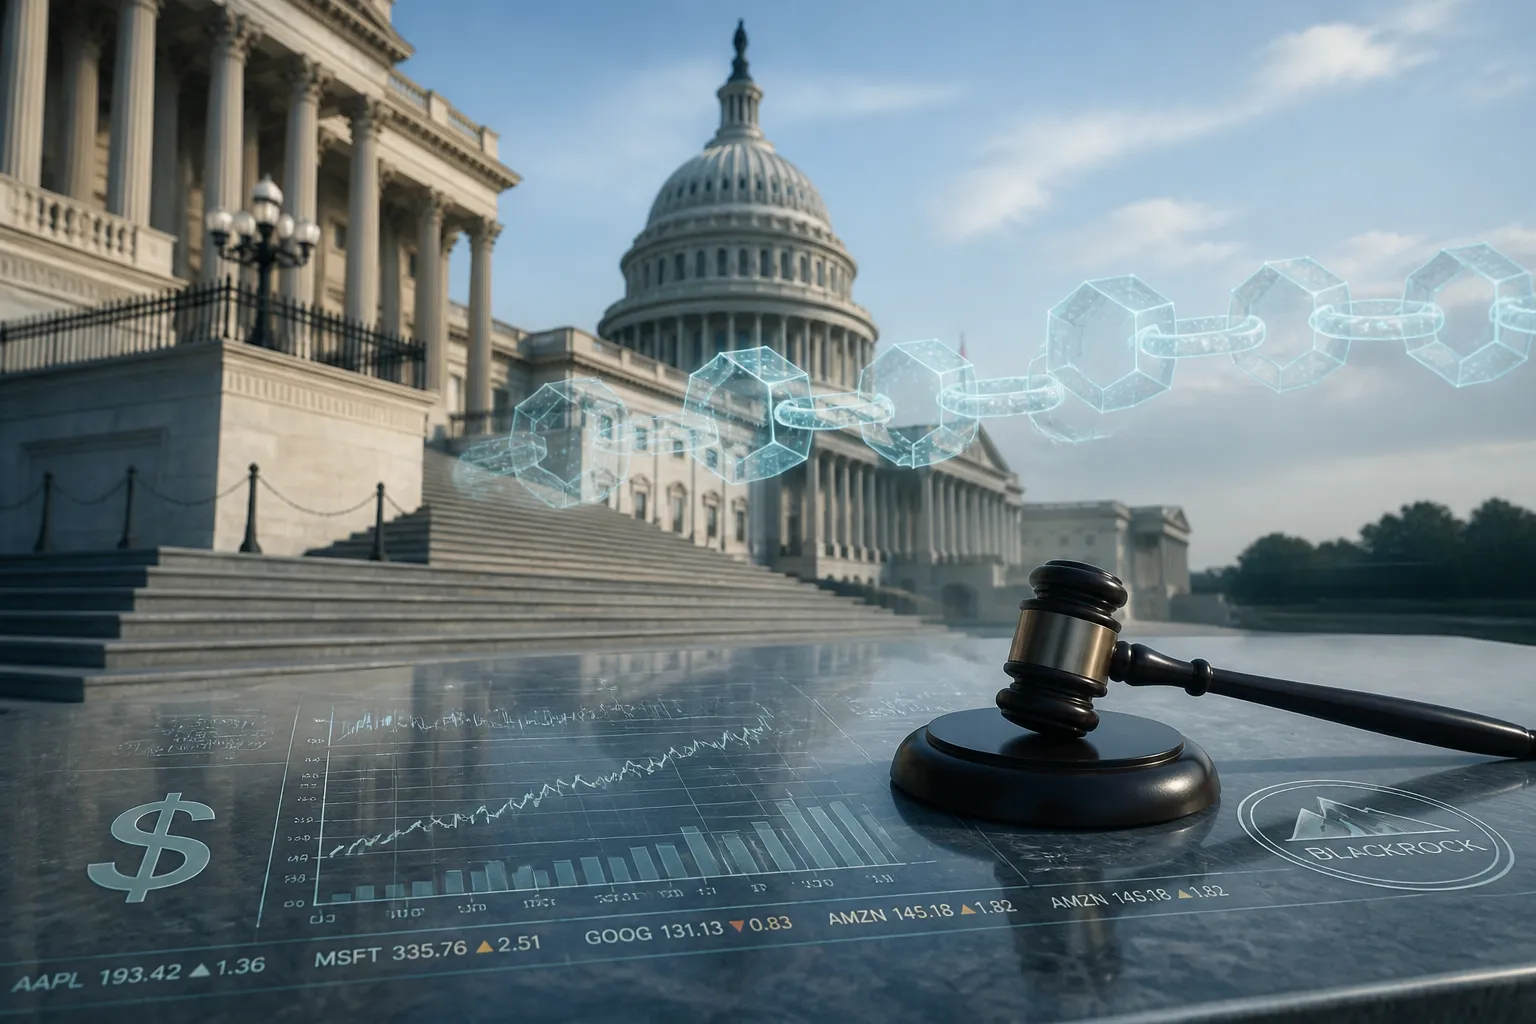
Wall Street’s wallets have opened a new chapter for Bitcoin, with a record $85.85 million flowing into U.S. spot ETFs on June 12. The surge followed five straight days of net outflows, a pattern that has long been a red flag for institutional sentiment. The sudden reversal suggests that Wall Street investors are re‑entering the market in anticipation of a price turnaround.
According to SoSoValue, the June 12 inflow is the largest single‑day movement seen in the week and the biggest since the launch of the first U.S. spot Bitcoin ETF. The data come after a period of net outflows that had raised concerns about institutional appetite. The influx indicates a shift in mood, with investors willing to commit capital after a cautious pause.
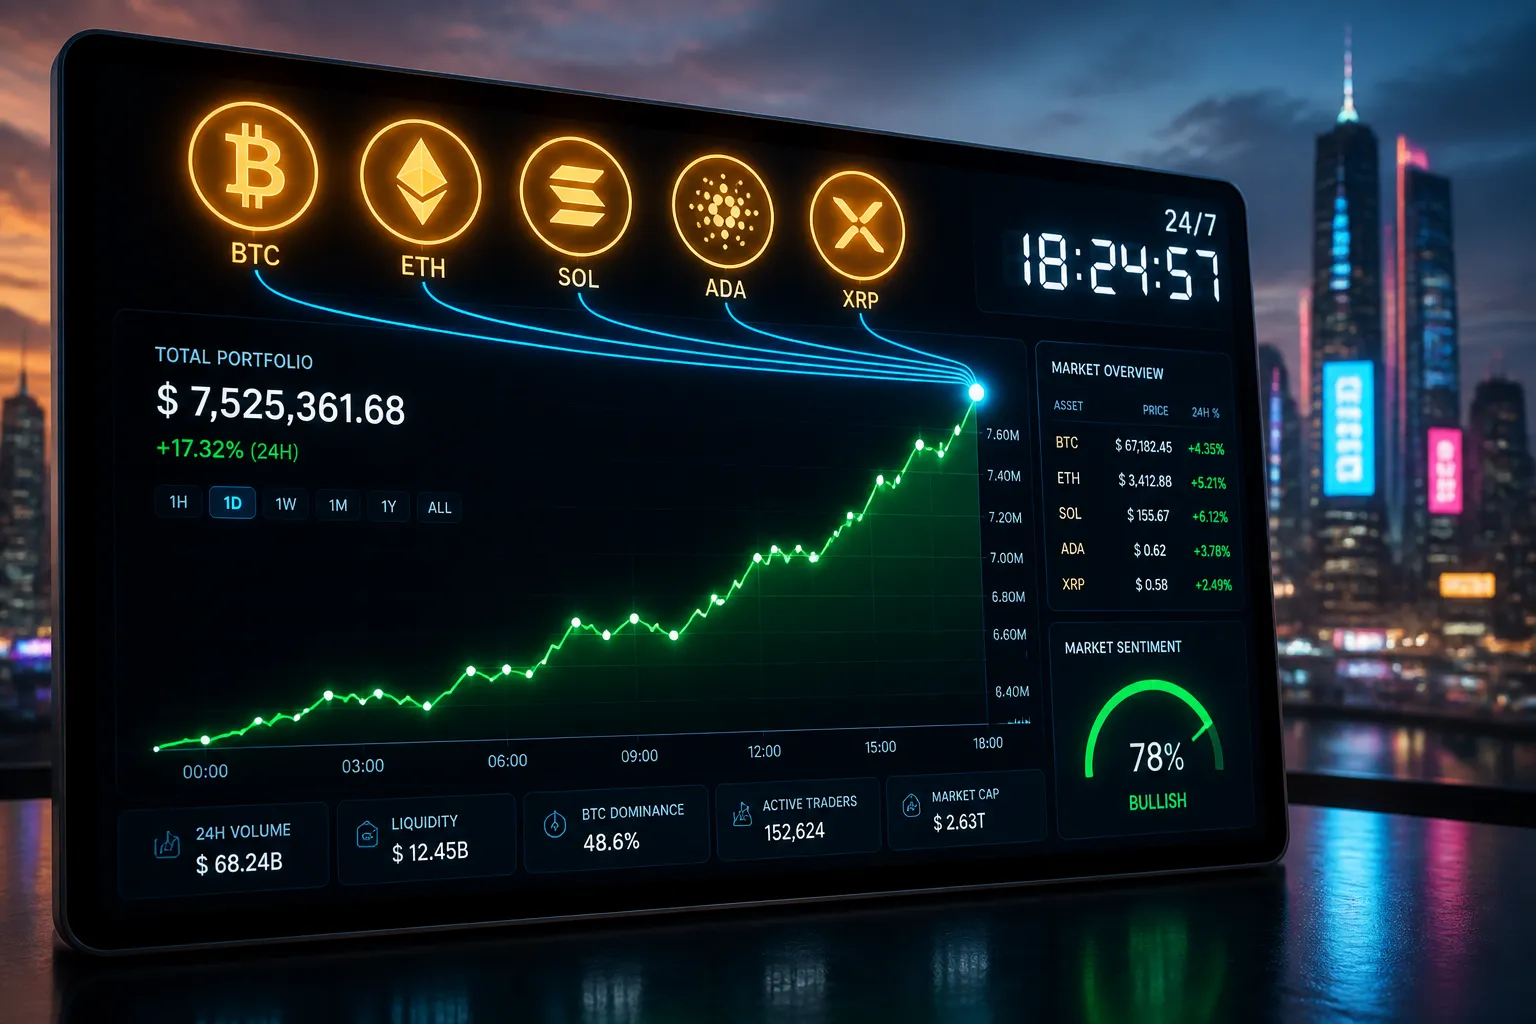
Bitcoin’s headline price rose 1.30 % over the previous 24 hours, hovering around $63,750 at the time of writing. Despite the modest gain, daily trading volume slipped 16 % to $24.07 billion, signaling that traders remain wary. The dip in volume underscores a market that is still measuring its next move.
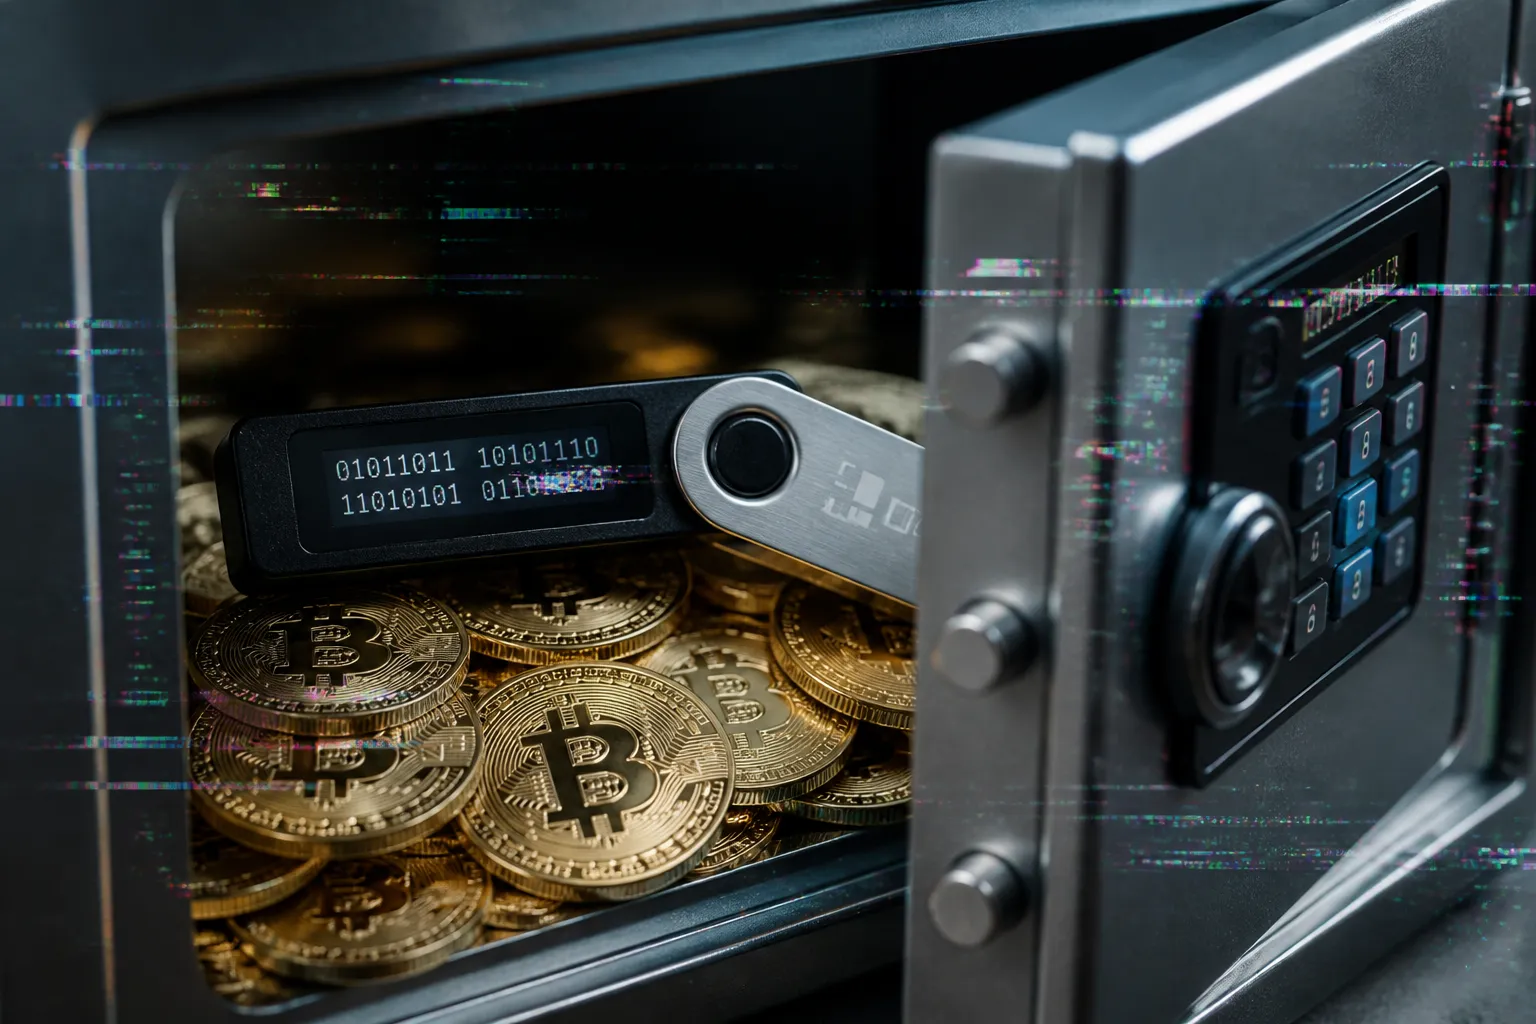
On‑chain activity adds another layer to the bullish narrative. Onchain Lens recorded that a newly created wallet withdrew 328 BTC—roughly $20.08 million—from Binance on the same day. Moving funds out of exchanges is a classic prelude to accumulation, suggesting that holders are positioning themselves for a potential rally.
Derivatives data reinforce the optimism. CoinGlass shows that Bitcoin’s long‑to‑short ratio climbed to 1.03, meaning long positions slightly outnumber short ones. The open‑interest‑weighted funding rate turned positive, reaching +0.0068 %. Together, these metrics point to a growing confidence among traders in an upside move.
The derivatives market also highlights two liquidation clusters. At $63,029 and $64,415, leveraged positions total $315 million in longs and $305 million in shorts. These clusters signal that the market could be primed for a breakout—or a retracement—depending on how the price reacts to the resistance level.
From a technical standpoint, Bitcoin is eyeing a key resistance zone at $63,900. The asset has lingered near this level for nine trading days, and each approach has been followed by selling pressure and a dip. If the price can close a daily candle above $64,000, it could trigger a further upward move.
TradingView’s daily chart suggests that a breakout above $64,000 could allow Bitcoin to gain more than 8 % and potentially reach $69,500. However, should the asset fail to breach the resistance, the chart indicates that selling pressure may resume, leading to a decline.
In sum, the combination of a significant ETF inflow, on‑chain withdrawals, bullish derivatives metrics, and a technical resistance level paints a cautiously optimistic picture. Traders and investors are watching the $63,900 zone closely, as its outcome will likely dictate the next phase of Bitcoin’s price action.
The current landscape remains fluid. While institutional inflows and bullish derivatives data point to confidence, the market’s volume decline and the technical resistance level introduce uncertainty. Market participants will need to monitor how the price reacts to the $64,000 threshold and whether the bullish sentiment translates into sustained upward momentum.
According to SoSoValue, the June 12 inflow is the largest single‑day movement seen in the week and the biggest since the launch of the first U.S. spot Bitcoin ETF. The data come after a period of net outflows that had raised concerns about institutional appetite. The influx indicates a shift in mood, with investors willing to commit capital after a cautious pause.
Bitcoin’s headline price rose 1.30 % over the previous 24 hours, hovering around $63,750 at the time of writing. Despite the modest gain, daily trading volume slipped 16 % to $24.07 billion, signaling that traders remain wary. The dip in volume underscores a market that is still measuring its next move.
On‑chain activity adds another layer to the bullish narrative. Onchain Lens recorded that a newly created wallet withdrew 328 BTC—roughly $20.08 million—from Binance on the same day. Moving funds out of exchanges is a classic prelude to accumulation, suggesting that holders are positioning themselves for a potential rally.
Derivatives data reinforce the optimism. CoinGlass shows that Bitcoin’s long‑to‑short ratio climbed to 1.03, meaning long positions slightly outnumber short ones. The open‑interest‑weighted funding rate turned positive, reaching +0.0068 %. Together, these metrics point to a growing confidence among traders in an upside move.
The derivatives market also highlights two liquidation clusters. At $63,029 and $64,415, leveraged positions total $315 million in longs and $305 million in shorts. These clusters signal that the market could be primed for a breakout—or a retracement—depending on how the price reacts to the resistance level.
From a technical standpoint, Bitcoin is eyeing a key resistance zone at $63,900. The asset has lingered near this level for nine trading days, and each approach has been followed by selling pressure and a dip. If the price can close a daily candle above $64,000, it could trigger a further upward move.
TradingView’s daily chart suggests that a breakout above $64,000 could allow Bitcoin to gain more than 8 % and potentially reach $69,500. However, should the asset fail to breach the resistance, the chart indicates that selling pressure may resume, leading to a decline.
In sum, the combination of a significant ETF inflow, on‑chain withdrawals, bullish derivatives metrics, and a technical resistance level paints a cautiously optimistic picture. Traders and investors are watching the $63,900 zone closely, as its outcome will likely dictate the next phase of Bitcoin’s price action.
The current landscape remains fluid. While institutional inflows and bullish derivatives data point to confidence, the market’s volume decline and the technical resistance level introduce uncertainty. Market participants will need to monitor how the price reacts to the $64,000 threshold and whether the bullish sentiment translates into sustained upward momentum.