Blab Crypto
Bitcoin Holds at $60,000 Support; Traders Await Decision on Next Move
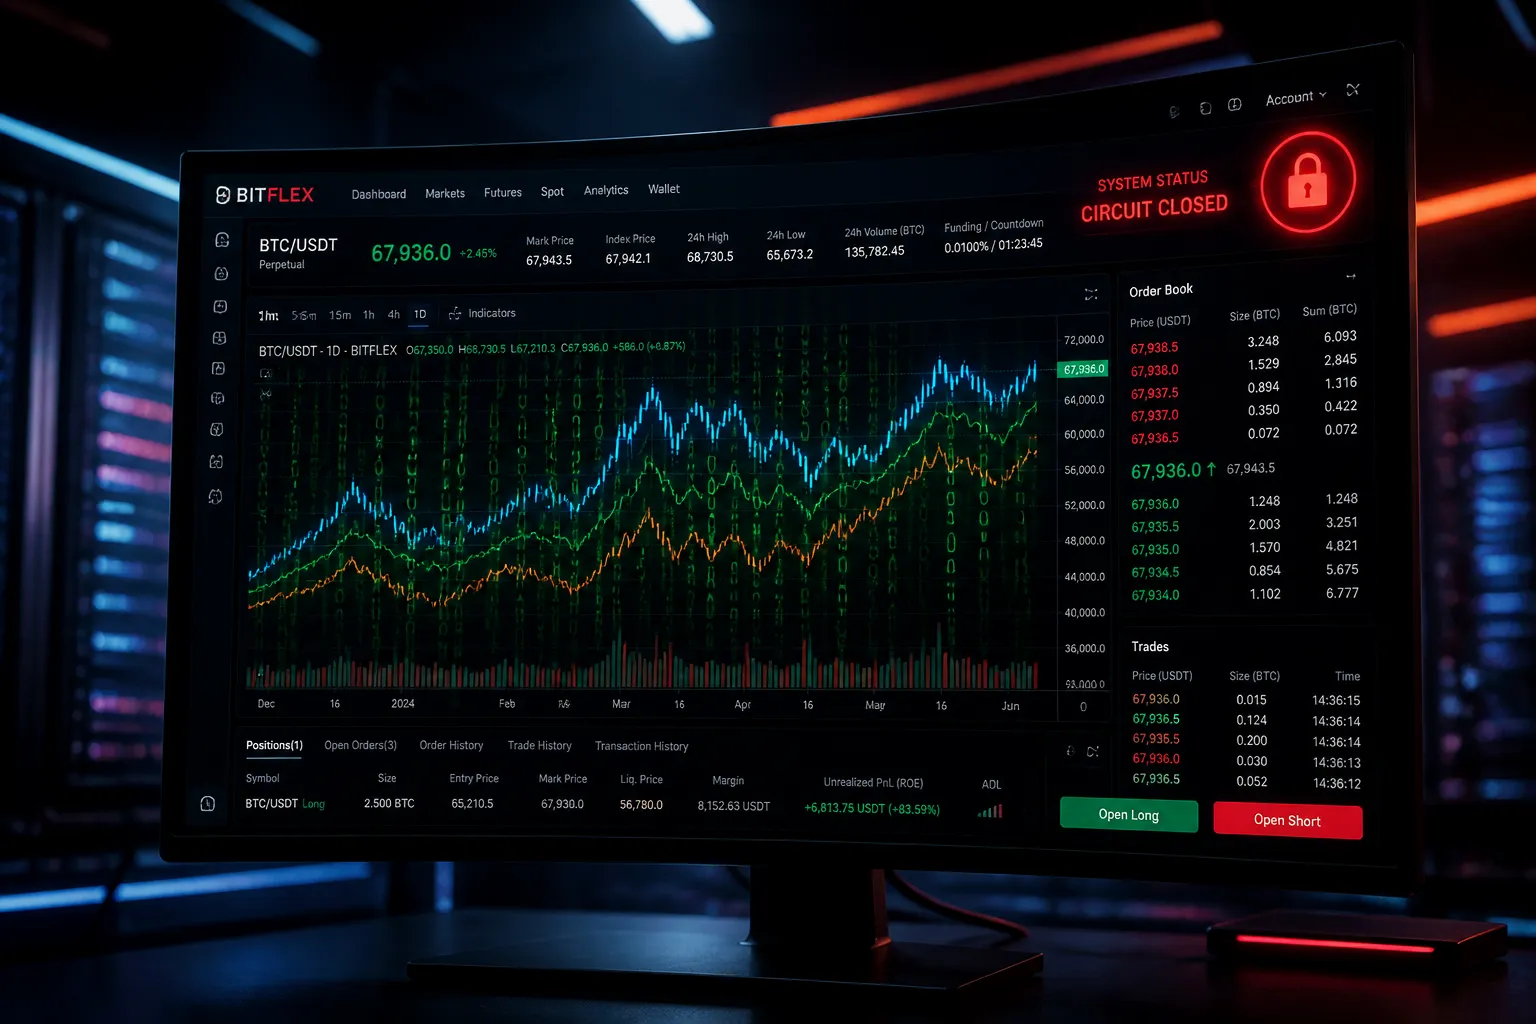
Bitcoin is heading into the weekend perched on the edge of the $60,000 support zone, a level that has become the centerpiece of technical discussions on TradingView. Recent charts posted on June 20 by traders heniitrading, weslad, and behdark illustrate the digital gold hovering in a narrow corridor between two key liquidity points: a demand zone near $60,000 and a supply zone close to $67,000.
The bullish narrative, charted by heniitrading, frames Bitcoin’s recent bounce as a potential springboard for a stronger recovery. According to the analysis, the price has rebounded from channel support after breaking above resistance, and it is currently holding above a $63,700 demand zone while still trading below a $67,000 supply zone. In this scenario, buyers would need to lift the price into the upper area to prove that the current buying pressure is not merely a weak relief move.
The bearish perspective, offered by weslad, focuses on the $60,000 line. The trader argues that Bitcoin is sitting on a fresh demand zone, and the market’s ability to respect that area will determine whether a recovery toward higher liquidity and supply zones remains viable. A decisive close below $60,000 would erode the bullish case and expose the market to a more serious downside extension.
Behdark’s analysis echoes this sentiment, pinpointing the $61,000 zone as the key reaction area on the four‑hour chart. A robust response from buyers could support a move toward $72,000, while failure to hold the green support zone would keep a bearish wave structure in play and raise the probability of a slide toward $56,000.
What traders are watching next
For short‑term traders, the market presents a relatively clean decision zone. Bulls must defend the low‑$60,000 area and reclaim nearby resistance to keep the recovery structure alive. Bears need to force a breakdown below that same zone to turn the recent bounce into another failed reaction.
This makes the next few candles crucial. A push through $67,000 would reinforce the recovery argument, while a daily close below $60,000 would likely amplify the breakdown camp. Until then, Bitcoin remains trapped in a high‑tension range where both sides have technically credible cases.
Background
Bitcoin (BTC) is the first decentralized cryptocurrency, introduced in 2008 by the pseudonymous Satoshi Nakamoto. It operates on a peer‑to‑peer network that records transactions on a public ledger called the blockchain. Bitcoin’s price has historically been highly volatile, with support and resistance levels often forming around psychologically significant thresholds such as $60,000, $70,000, and $80,000.
Current situation
As of the latest TradingView data, Bitcoin is trading just below $67,000, with the $60,000 support zone still intact. The next market move will hinge on whether buyers can hold the demand zone and push the price higher, or whether sellers can break below it and trigger a deeper decline. No regulatory or fundamental news has altered the technical landscape, so the focus remains on price action and the behavior of market participants.
In summary
Bitcoin’s position near the $60,000 support level is a critical juncture. A sustained rally above this zone could signal a new upward trend, while a breach could lead to a more pronounced correction. Traders and observers will be watching the next few hours and the daily close to gauge the market’s direction.