Blab Crypto
Bitcoin and Ethereum Face Bearish Rejection Amid Rising Market Risk, Analysts Report
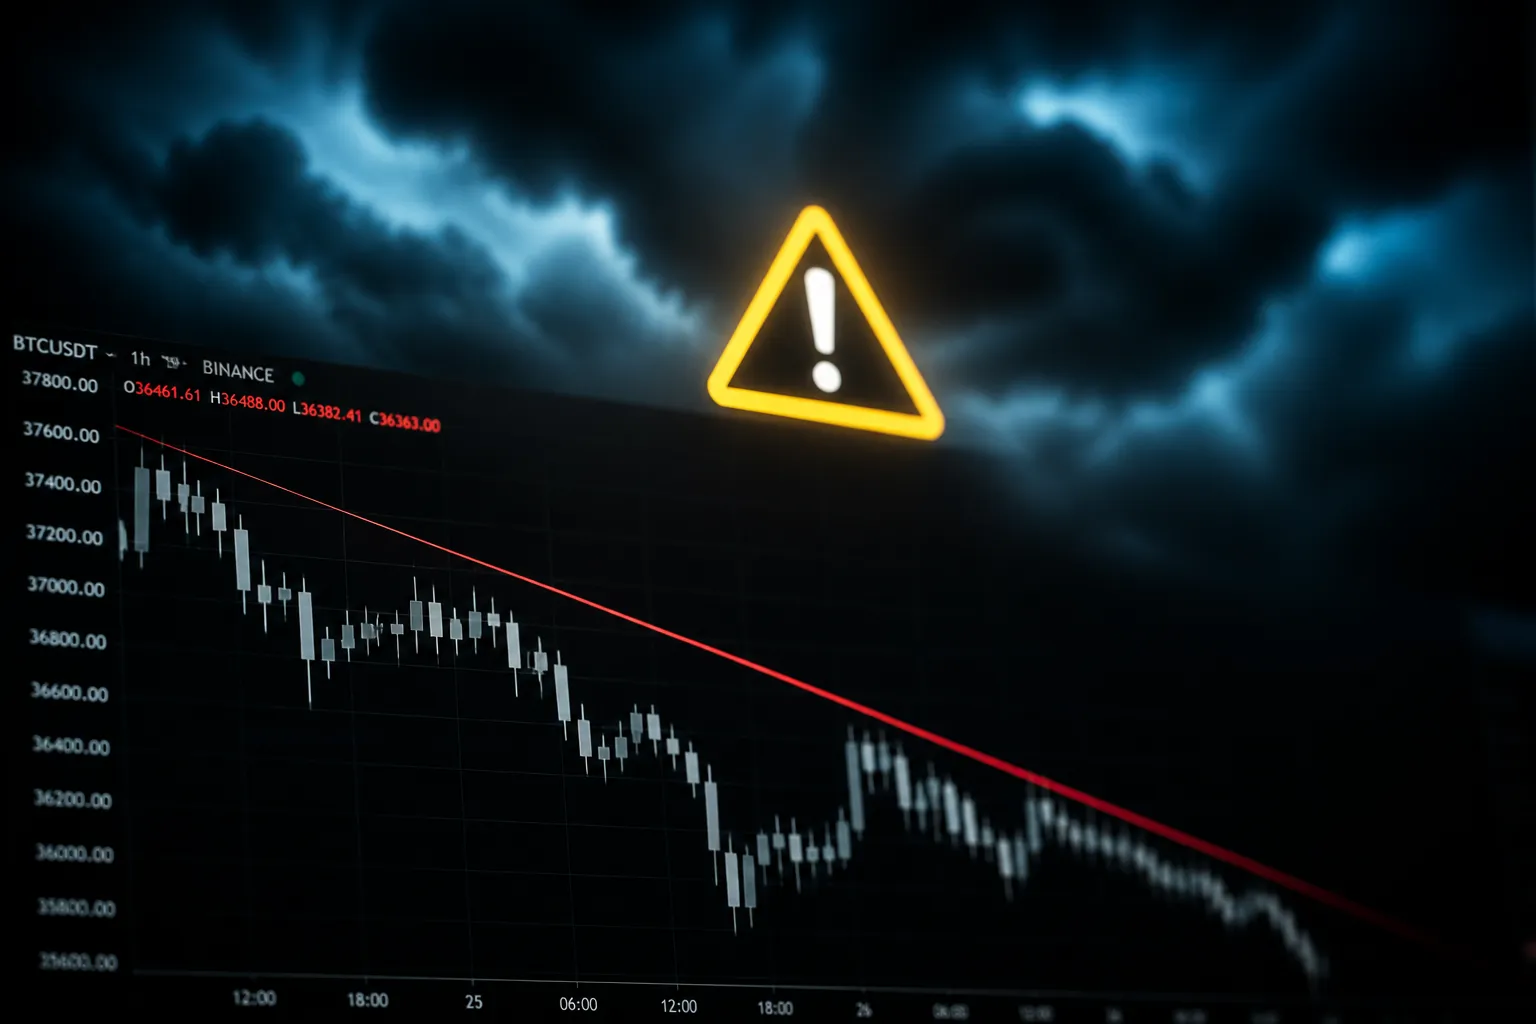
On Monday, Bitcoin’s price action tested a key bear‑flag support level but was rejected, confirming a continued bearish trend. The move, recorded at 5:41 AM GMT‑7 on June 23 2026, also left Ethereum in a similar downtrend and raised concerns about broader crypto risk.
Bitcoin’s daily chart showed a short‑term upper‑wick rally that reached the TBO Fast line but failed to break the bear‑flag support zone. The rejection is interpreted as a confirmation that the former support now acts as resistance. The chart’s next lower objective is near $46,870, below the next artificial support around $49,000. Supporting indicators – negative On‑Balance‑Volume (OBV), negative TBO, weak volume, and an RSI near 50 – do not contradict the bearish stance. The analysis suggests the price action offers short‑term entry opportunities rather than a trend reversal.
Ethereum did not form a new bear‑flag pattern, yet it also failed to regain lost short‑term support. The upper wick reached the TBO Fast line but did not recover previous levels, and trading volume remained subdued. The daily assessment therefore remains strongly bearish, reinforcing the risk‑off environment that could keep altcoins under pressure.
Stablecoin dominance, which had been trending upward, was disrupted by volatile swings in Bitcoin and Ethereum. The lower wick re‑entered the TBO Cloud, undermining the uptrend and hinting at a possible short‑term decline or breakdown within the Cloud. The critical resistance level is the TBO Resistance at 12.506 %. Until combined stablecoin dominance closes above this threshold, the chart has not returned to a safe zone. BTC.D spiked into the Fast line and TBO Cloud, OTHERS.D fell lower within its Cloud, and OTHERS/BTC closed inside the daily Cloud, shifting from bullish to bearish consolidation.
Macroeconomic indicators also signal tightening risk. The U.S. Dollar Index (DXY) is approaching 101 and appears short‑term overbought, while EURUSD is short‑term oversold. The most notable move is in USDJPY, which peaked at 161.926 on Monday, just 0.025 below the July 2024 high of 161.951. The pair is building toward a second weekly TBO breakout with an RSI above 70, and the yen is trading near levels last seen in 1986, raising the possibility of Bank of Japan intervention. Volatility in USDJPY could spill over to Japan‑linked risk assets such as the Nikkei.
U.S. equity futures add to the uncertainty. S&P futures are threatening another decline within the daily TBO Cloud, and the RSI is forming lower highs and lows without a bullish reset. While major indices – SPX, DJI, NDX, NVDA – are oscillating, the VIX remains bearish, and a sharp drop in SPCX on Monday may signal a short‑term top or euphoria.
Altcoins are largely defensive. XRP, BNB, SOL, and TRX are bearish or in bearish consolidation. HYPE approached its daily TBO Fast line but still has room for a deeper Cloud test near the white ascending support at $55. Tactical exceptions include WLD, which shows a 4‑hour bearish reversal warning; DEXE, which gained over 20 %; AERO, which remains strongly bullish; H, which fell 33 %; and LAB, which bounced 65 % from Saturday to Monday.
In summary, the latest technical analysis confirms that Bitcoin and Ethereum are still in a bearish phase, stablecoin dominance shows potential short‑term weakness, and macro indicators point to tightening risk in currency and equity markets. The crypto market remains sensitive to short‑term price action, and further developments in the TBO Cloud, stablecoin dominance, and USDJPY could shape the next few trading days.